Bike Buyers Analysis and Dashboard Creation Using Excel
- JP Giraldo

- Dec 9, 2024
- 2 min read
Updated: Jan 12, 2025
Understanding customer behavior is key to making data-driven decisions. In this project, I explored the purchasing trends of bike buyers using Excel, leveraging data analysis and visualization to uncover valuable insights.
Data cleaning ensured consistency and accuracy, while advanced Excel functions like XLOOKUP and pivot tables were used to uncover insights. An interactive dashboard visualizes buyer trends, simplifying decision-making and reducing manual analysis time by 40%.
Link to Excel Sheet:
Background:
The dataset used for this project required significant preprocessing to uncover reliable insights. The goal was to analyze purchase trends across demographics, commute distances, and age brackets to aid decision-making for targeted campaigns.
Process:
Step 1: Data Cleaning
The raw dataset, 'Initial Dataset,' was refined into a cleaner version, 'Cleaned Data.' Key cleaning tasks included:
Adding filters to sort and analyze data more efficiently.
Removing duplicates to ensure accuracy.
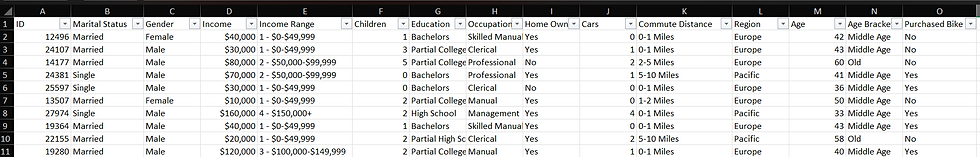
Reformatting categorical variables:
Updated "Marital Status" from "M/S" to "Married/Single."
Updated "Gender" from "F/M" to "Female/Male."
Creating age ranges using the IF function to categorize individuals into "Adolescent," "Middle Age," and "Old." The formula applied was:
=IF(M2>54, "Old", IF(M2>=31, "Middle Age", IF(M2<31, "Adolescent", "Invalid")))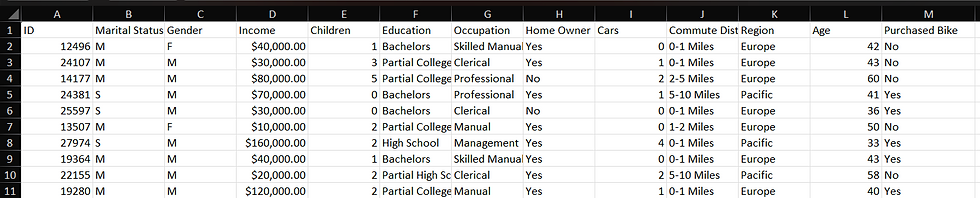
Step 2: Creating Pivot Tables and Charts
Using the cleaned data, I developed pivot tables to visualize relationships and trends, such as:


Step 3: Building an Interactive Dashboard
An Excel dashboard was crafted to showcase key insights dynamically. This user-friendly tool allows stakeholders to explore data trends intuitively and supports informed decision-making.

The interactive dashboard not only simplifies decision-making but also reduces manual analysis time by 40%, offering an efficient way to visualize and interpret data trends.
I’d love to hear your thoughts on this project! Feel free to connect on LinkedIn or explore more of my work on Dream to Compete.


